Core Metrics Dashboard
Core metric cards showing key KPIs such as total requests, Token consumption, and cost estimates.
Dashboard Overview
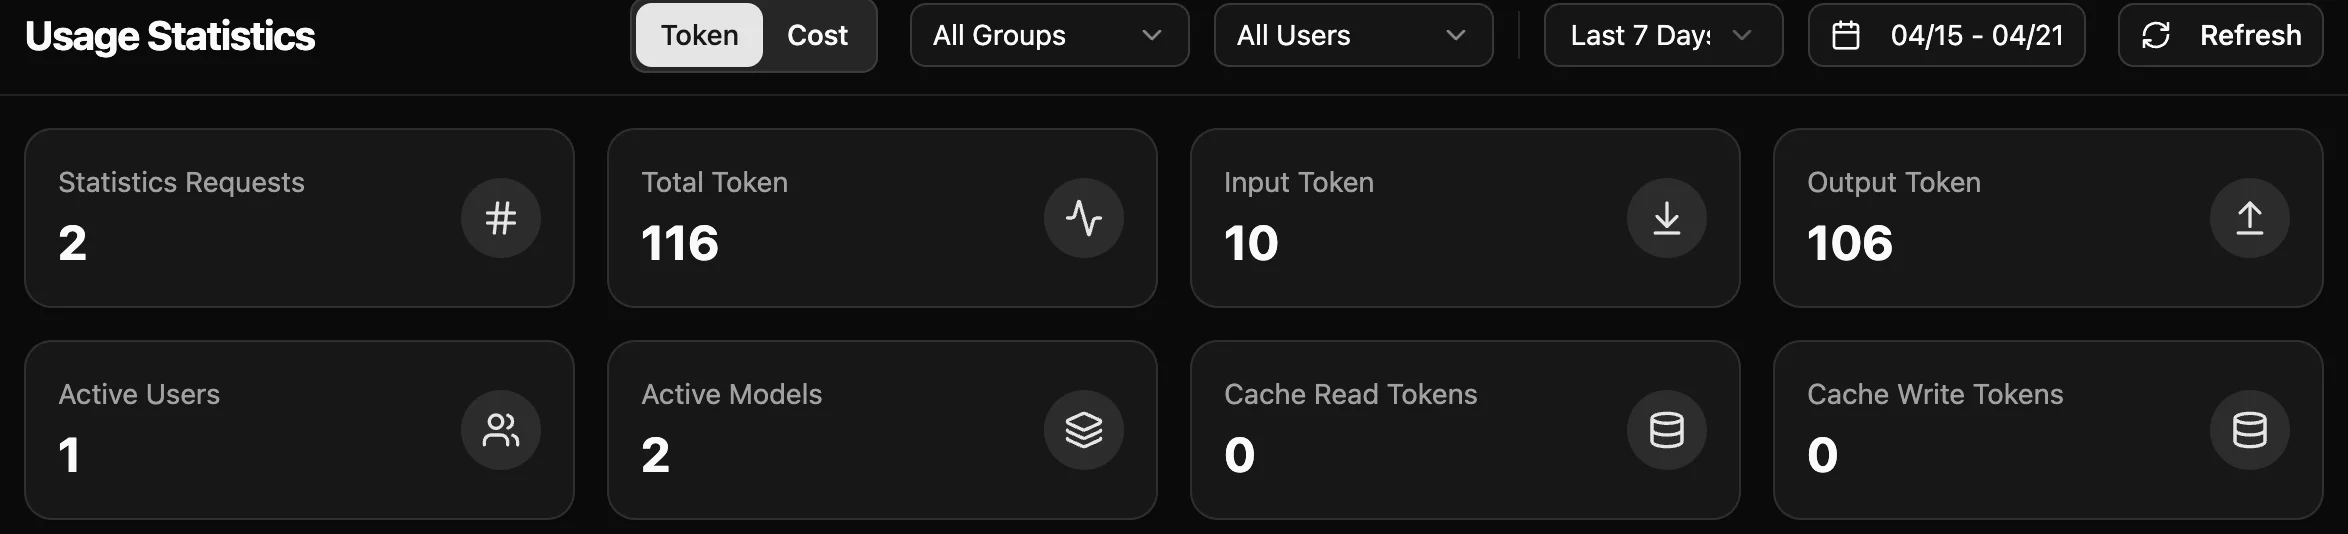
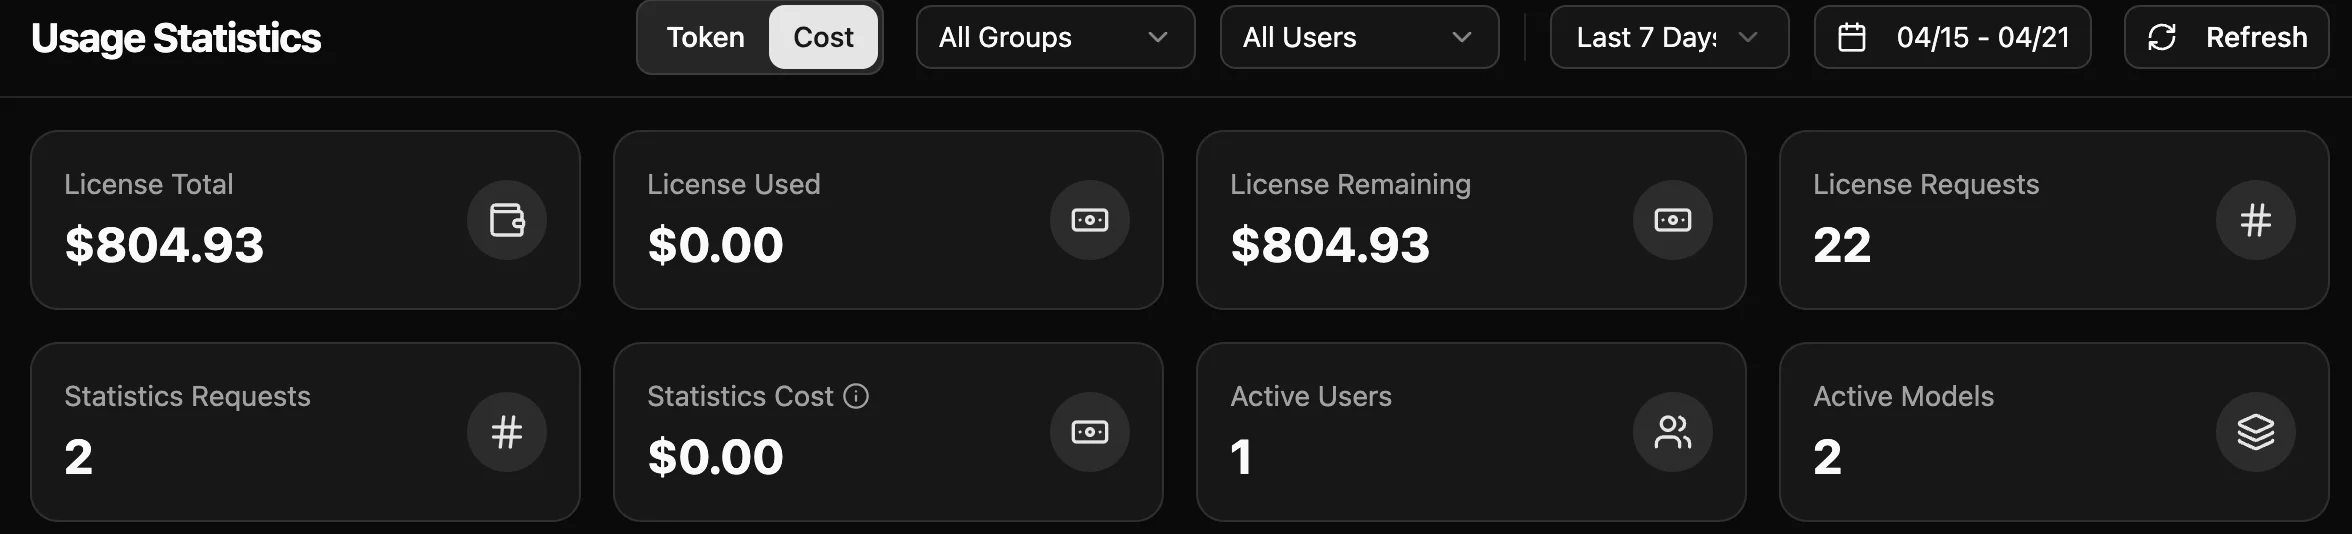
The core metrics dashboard displays key KPIs as metric cards, with both Token and Cost views.
Metric Details
| Metric | Description |
|---|---|
| Statistics Requests | Successful API calls to providers in the selected time range. |
| Total Token | Total tokens consumed (input + output). |
| Input Token | Prompt and context length sent to AI. |
| Output Token | Length of AI responses. |
| Active Users | Unique users who made calls in the selected time range. |
| Active Models | Number of AI models invoked. |
| Cache Read Tokens | Tokens served from cache without recalculation, reducing actual consumption. |
| Cache Write Tokens | Tokens written to cache for subsequent reuse. |
Metric Details
| Metric | Description |
|---|---|
| License Total | Total monetary quota of the current license. |
| License Used | Amount of license quota consumed. |
| License Remaining | Unused remaining license quota. |
| License Requests | Maximum number of requests allowed by the license. |
| Statistics Requests | Actual API calls made in the selected time range. |
| Statistics Cost | Actual cost incurred in the selected time range. |
| Active Users | Unique users who made calls in the selected time range. |
| Active Models | Number of AI models invoked. |