Dimension Stats and Comparison
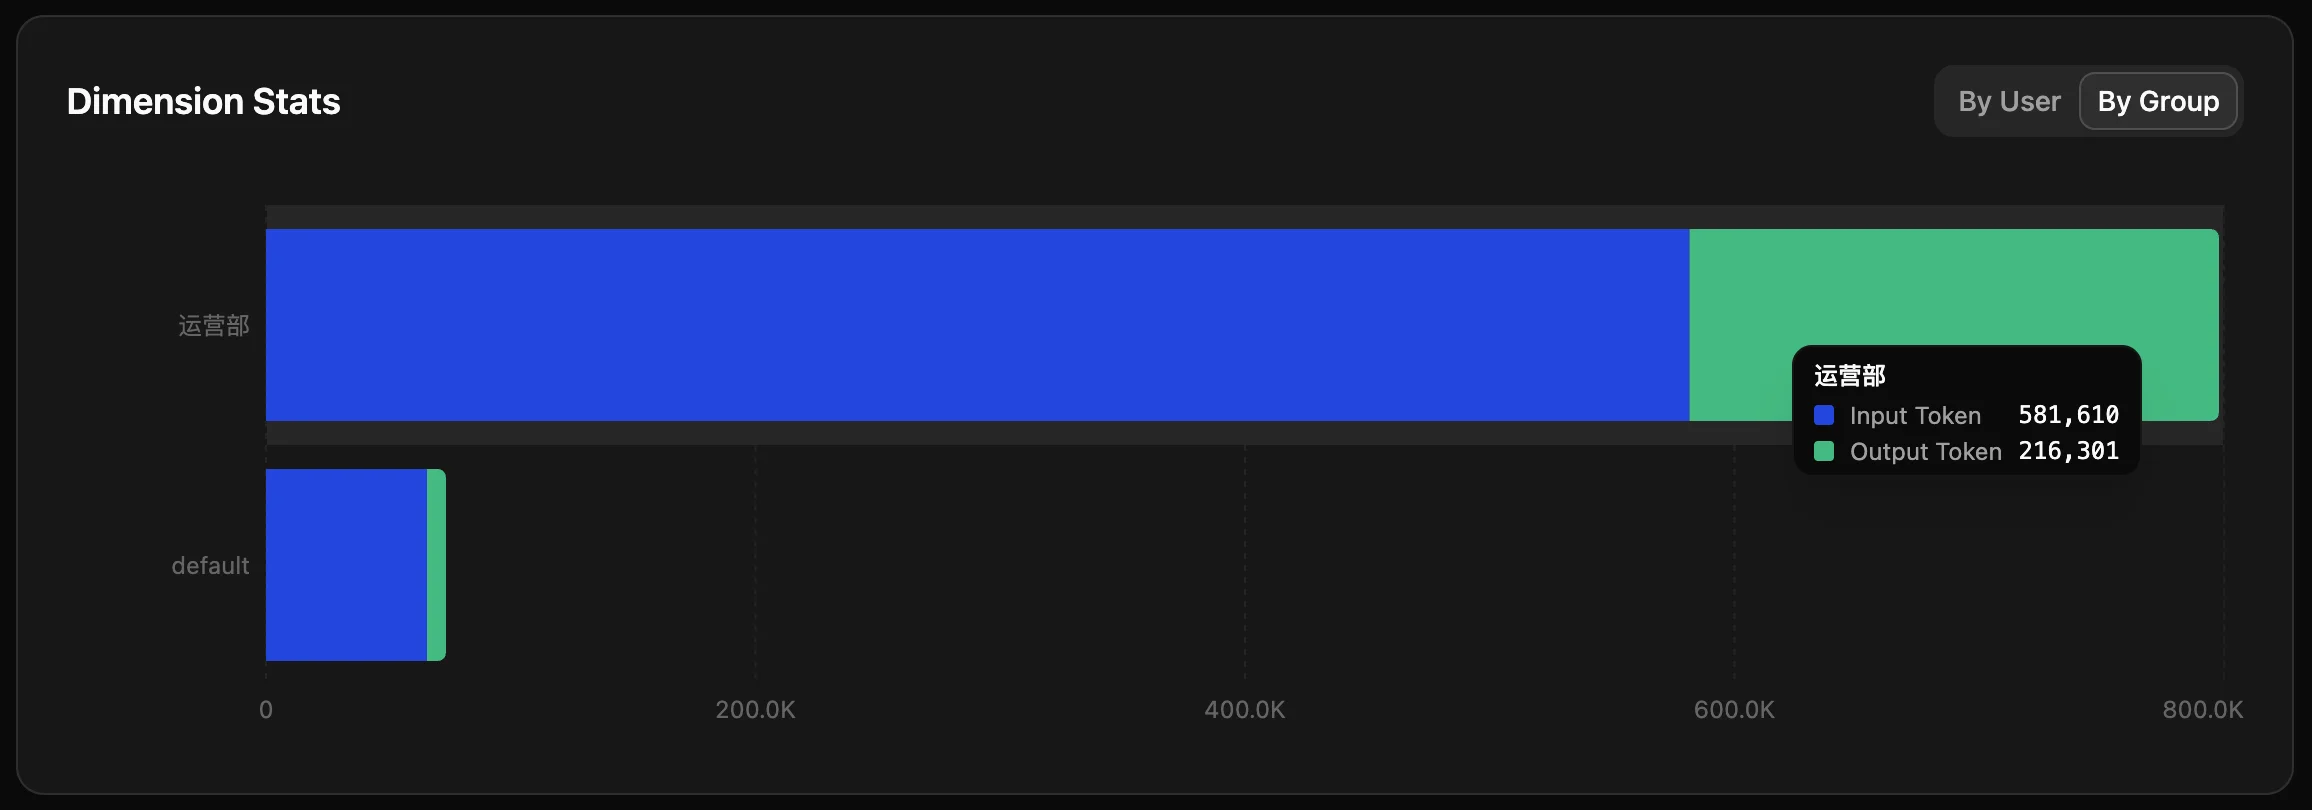
Switch between user and group dimensions to compare resource consumption across departments and individuals.
How to Use
Click By User / By Group in the top right to switch.
- By Group: Shows resource usage by department. For example, R&D usually consumes more tokens than admin.
- By User: Quickly identify power users. Blue is input tokens, green is output tokens, showing whether users read long inputs or generate long outputs.