Filters and Controls
Filter analytics by group, user, model, and time range — all charts update in real time.
Dynamic Preview
At the top of the page, admins can define the analysis scope with fine-grained filters. All charts and lists below update in real time.
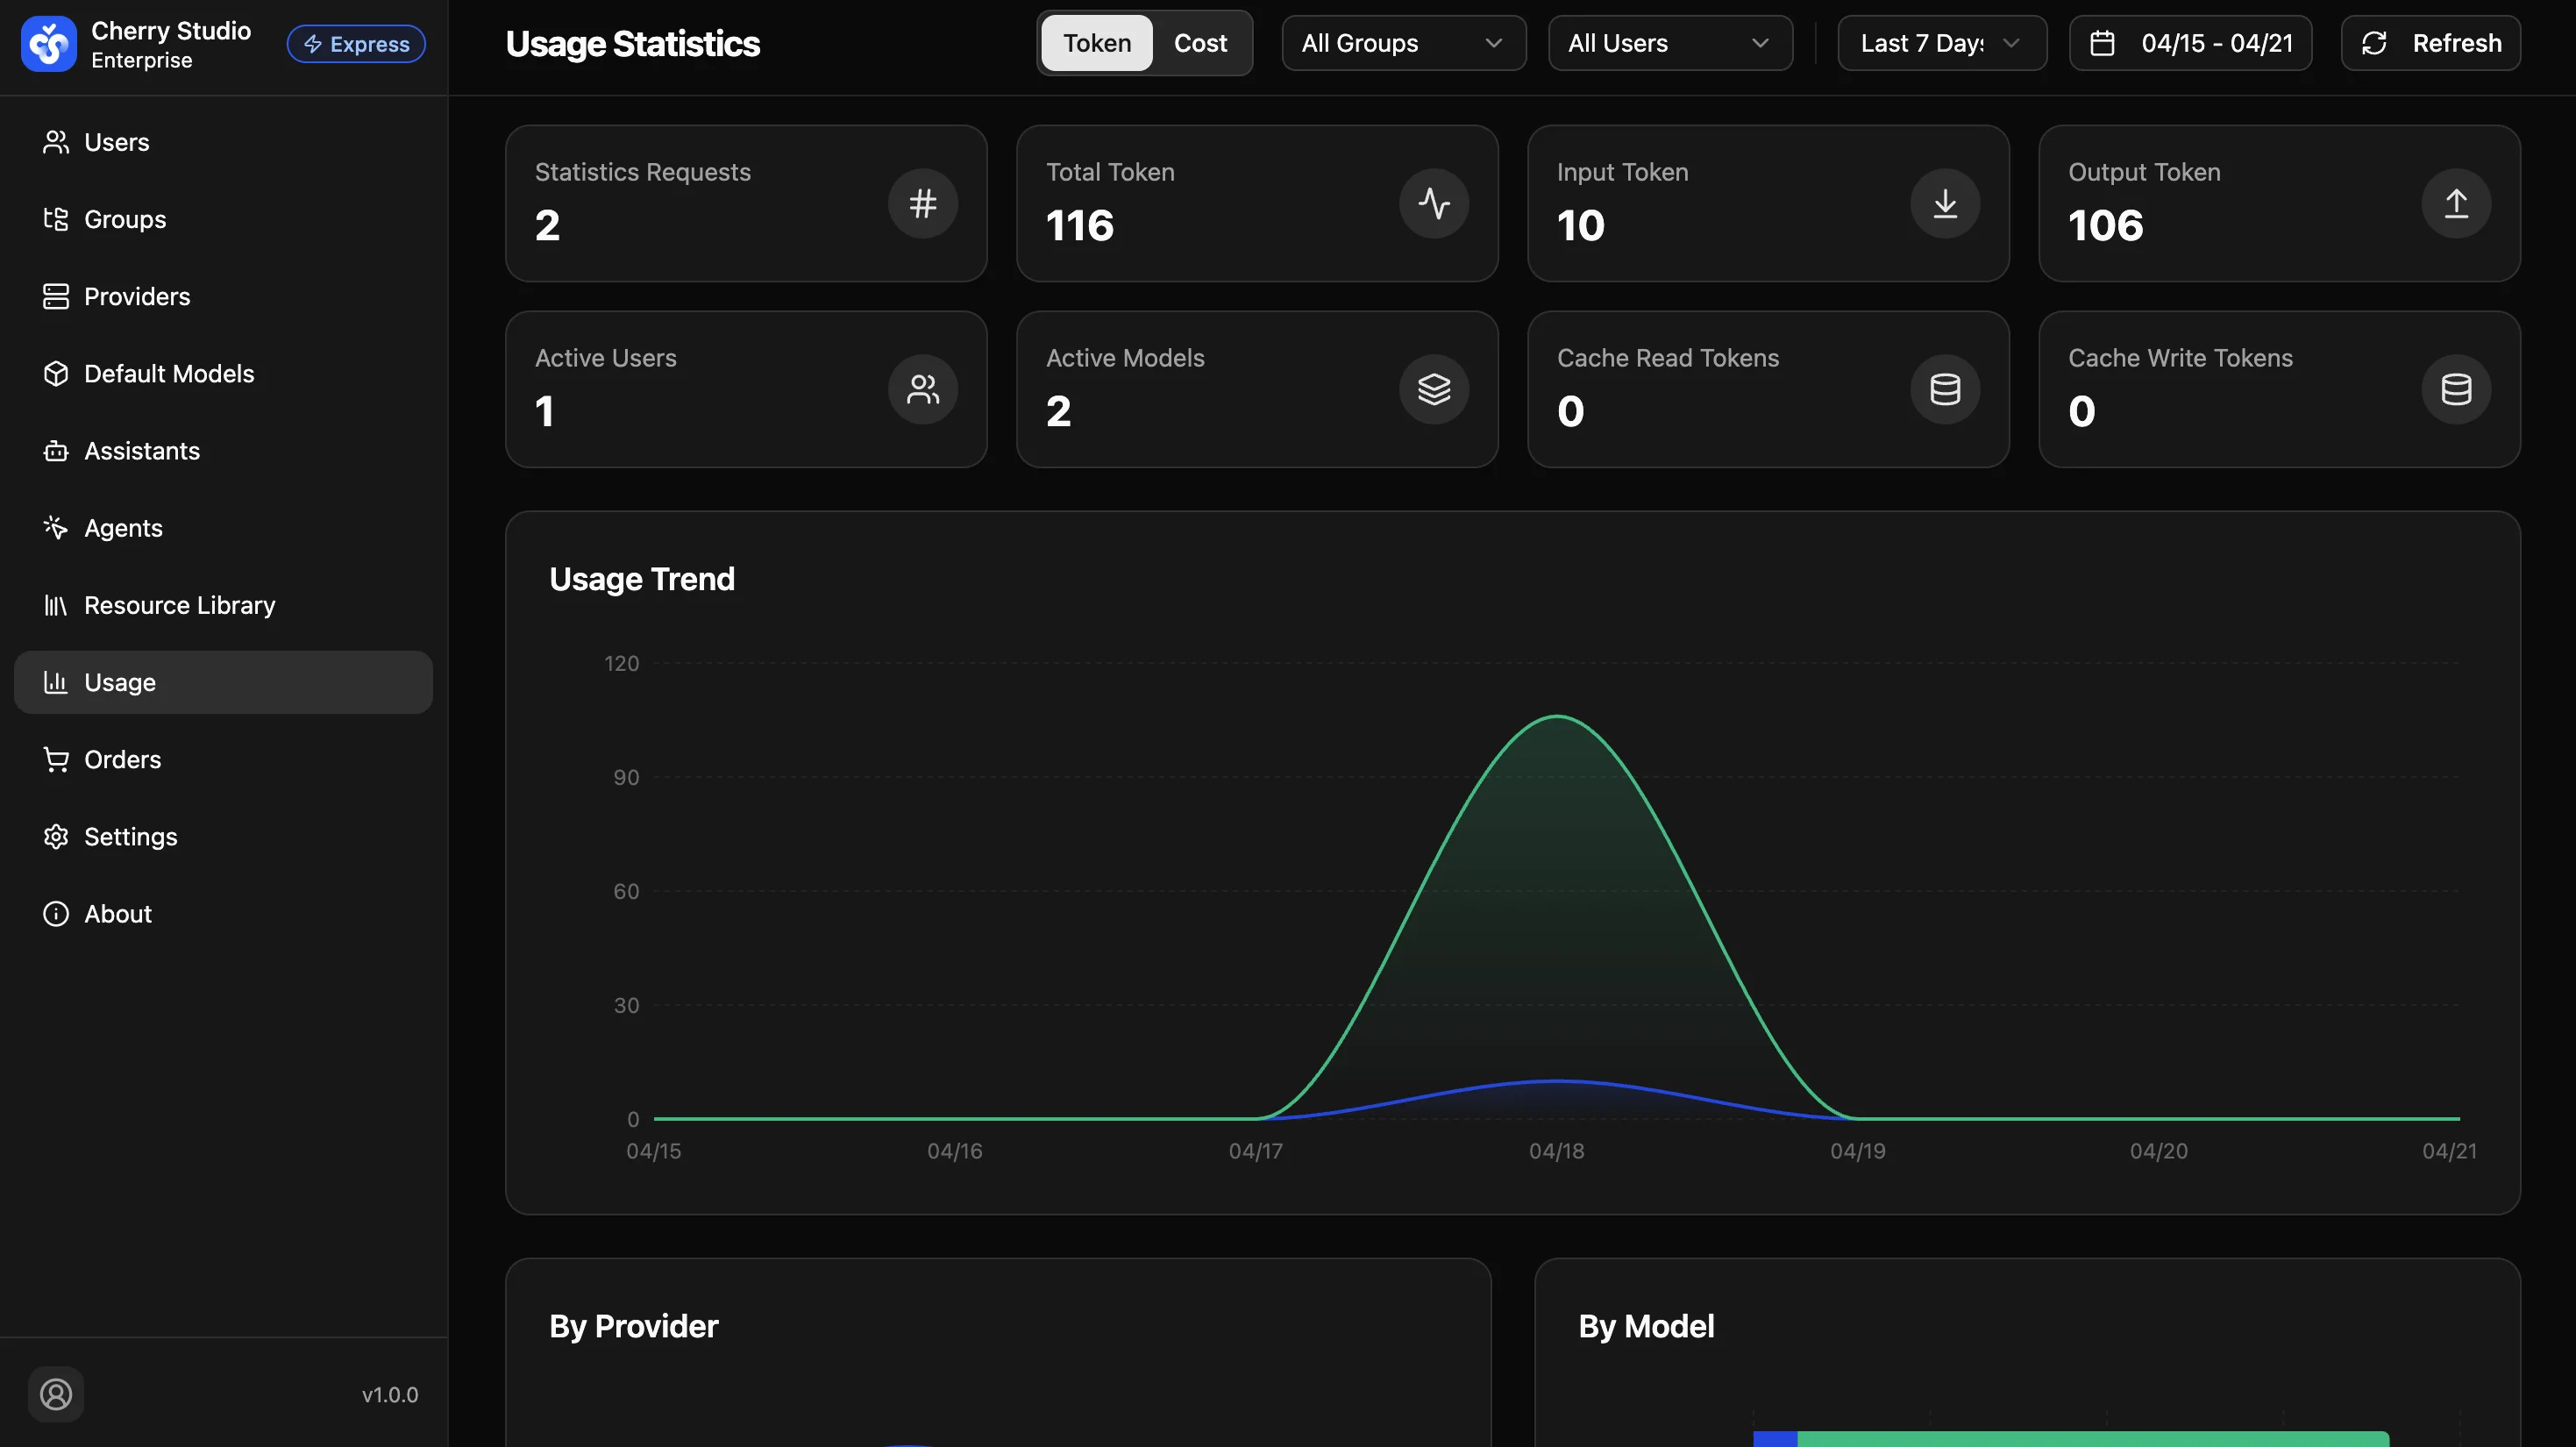
The filter bar provides a Token / Cost toggle to quickly switch between token usage and cost consumption views.
Feature Descriptions
| UI Element | Description | Business Scenario |
|---|---|---|
| All groups | Filter by org structure (e.g., Product, R&D) | Evaluate AI ROI by department |
| All users | Search and select specific users | Audit abnormal high-frequency calls or token usage |
| Time range | Quick select (today, last 7/30 days) or custom | Compare usage before/after a rollout |
| Refresh | Reload current data | Get the latest monitoring data |
Note: Analytics may have a 1-2 minute delay due to distributed log aggregation. This is normal.