Trends and Distribution Visualization
Visualize Token consumption trends and model usage preferences through line and distribution charts.
Usage Trend
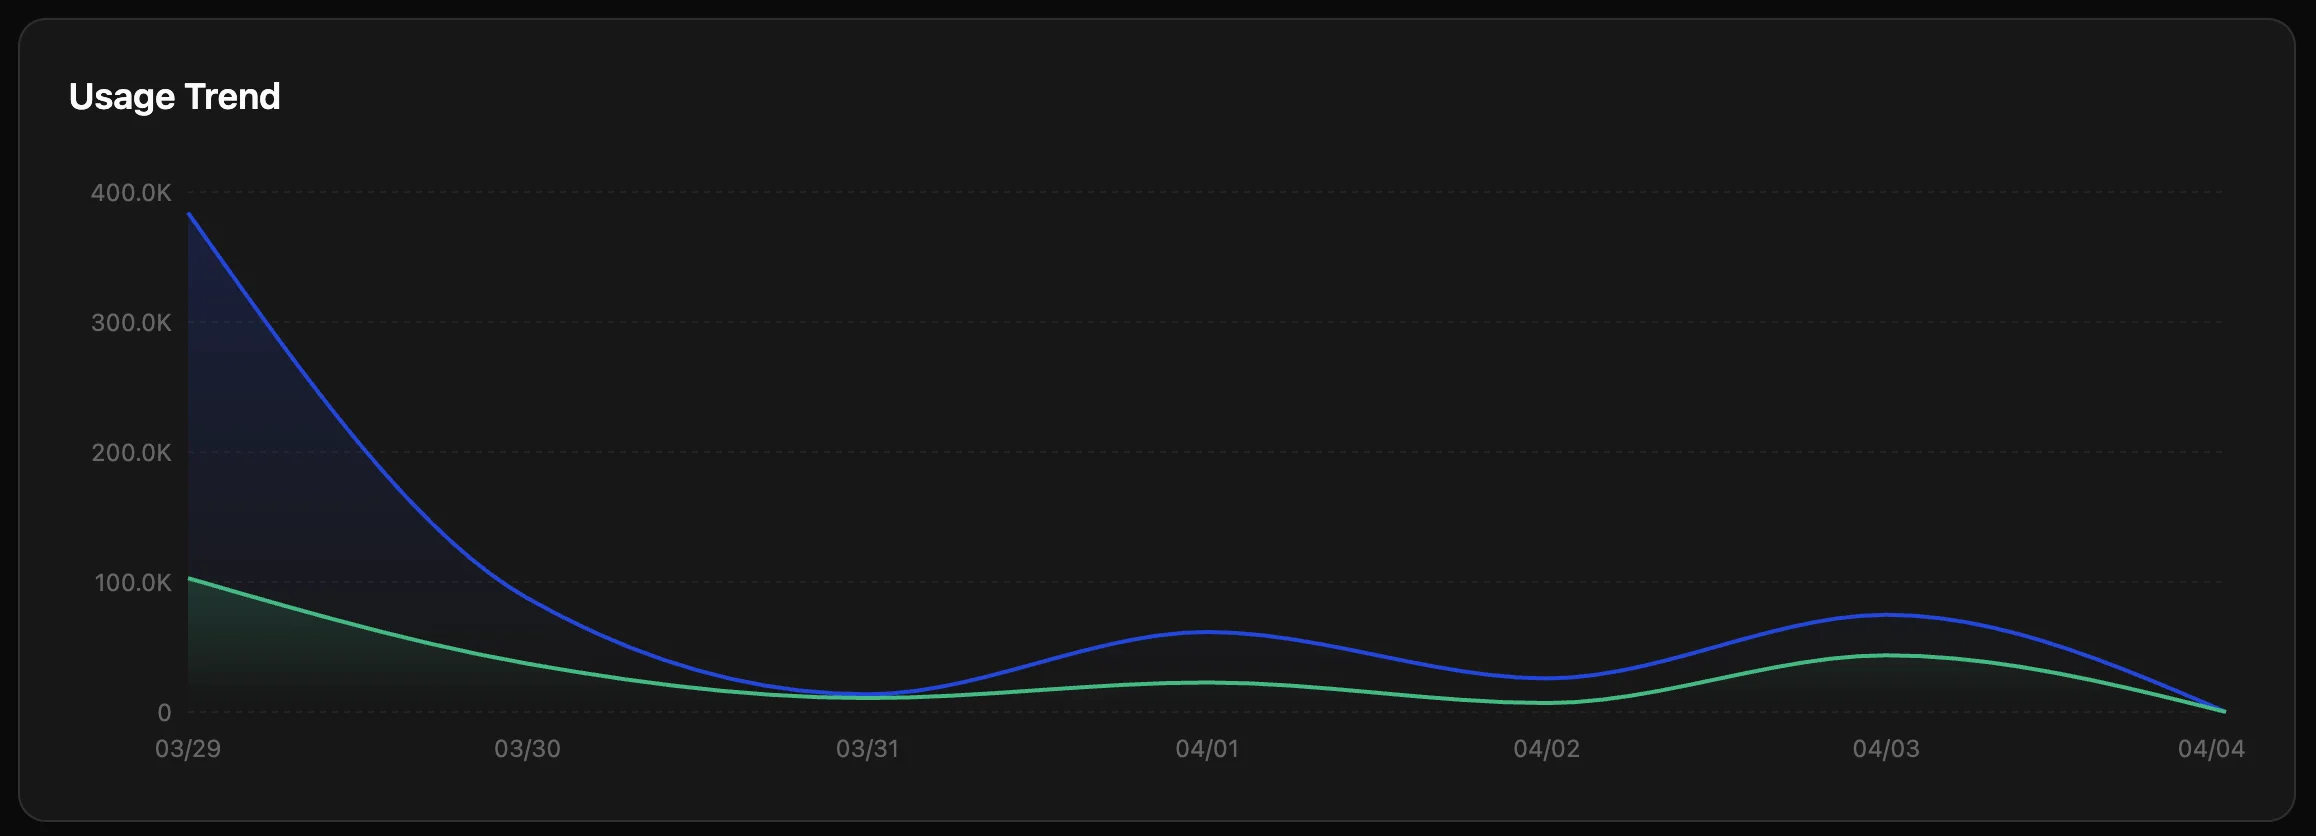
A line chart shows token consumption over time.
- Blue line: Total token usage.
- Green line: Reference dimension (usually output tokens).
- Value: Identify peak usage periods and plan concurrency quotas.
Model Distribution
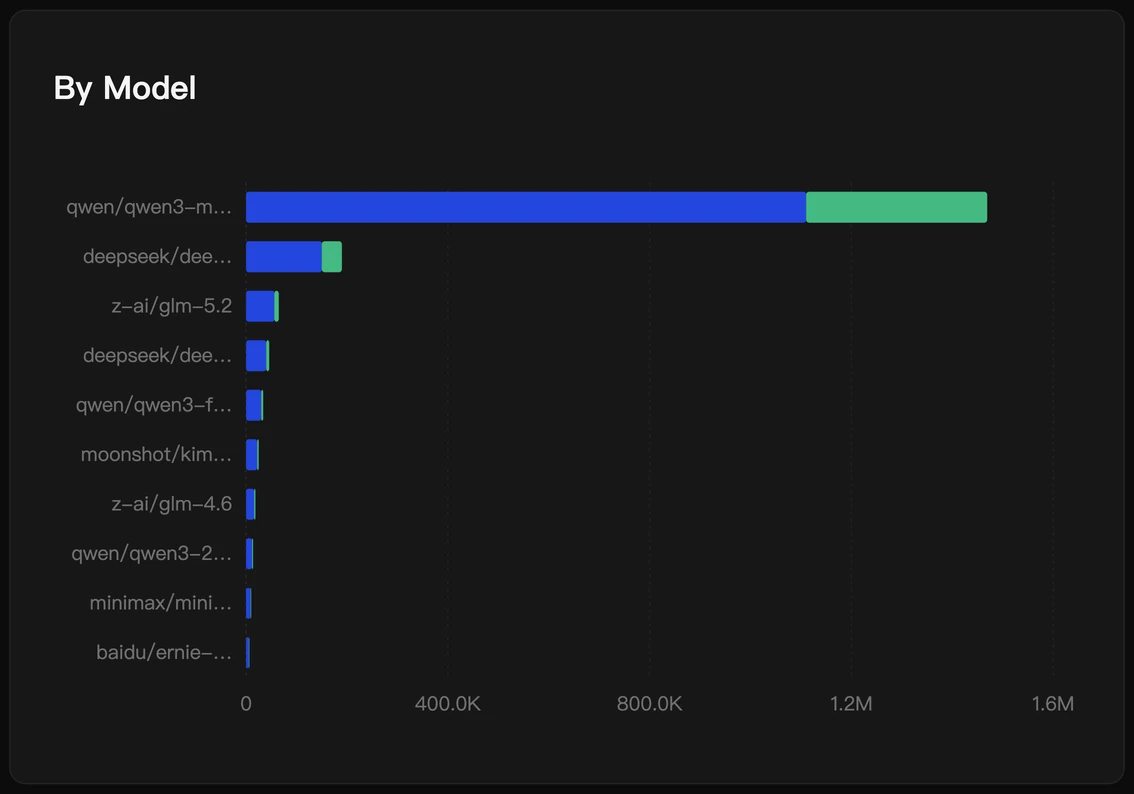
A bar chart shows the top models by consumption.
- Interaction: Hover to view values.
- Value: Understand user preferences. If
qwen3-maxis extremely high, consider guiding non-critical tasks to more economicalqwen3.5-flashordeepseek-v4-flash.